Homicides, Suicides, and Accidental Deaths in America
Last updated January 4, 2013†
Sharing
The above image is licensed under a Creative Commons Attribution license, meaning you can do just about anything you want with it. I ask only that you leave the URL for attribution and so viewers can check my sources and access subsequent versions of the diagram should I learn of better data. You can also find a copy of the image on Flickr.
What am I looking at?
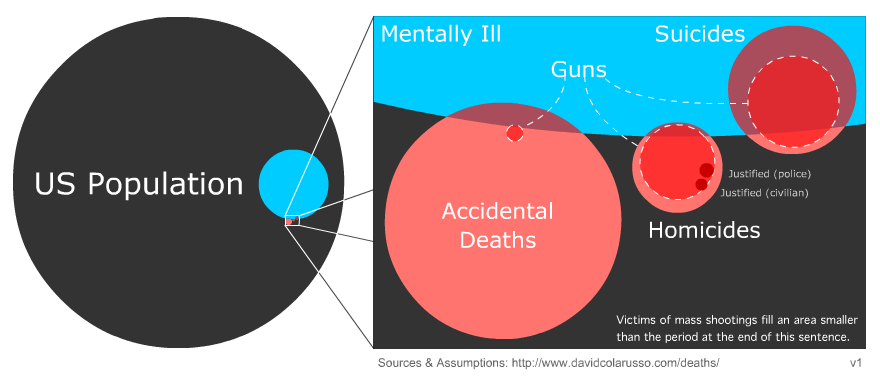
In the wake of the Sandy Hook shooting, I heard a lot of discussion surrounding the prevalence of guns and mental illness in America, and I found myself wondering, "How does it all fit together?" I wanted a Venn Diagram showing how mental illness, guns, and deaths in America fit together. Unable to find one, I produced this. I'm not sure what it suggests by way of policy, but it seems like a good discussion starter. My hope is that the graphic and links provided here will help spark and inform discussion. I also hope that visitors to this page will help refine my numbers. After all, I did mark the image with a version number, and I am the first to admit my data sets are incomplete. Help me shrink the error bars. Leave a comment below.
A peculiar aspect of the image is the nature of mental illness' intersections with accidental deaths, homicides, and suicides. The intersection with accidental deaths represents those people with mental illness who suffered accidental deaths. Given the nature of suicide, the intersection with suicides represents both those who died of suicide and those who committed suicide. The intersection with homicides, however, represents those homicides committed by individuals with mental illness. I feel there's something problematic about this dual presentation of the mentally ill as victims and causes. Also, in retrospect, the shifting nature of the intersecting sets doesn't seem as intuitively obvious as I would have liked. I'm thinking hard about these issues for any subsequent versions of the image, and I welcome your comments below.1
Sources & Assumptions
The data used here is primarily from 2008, the most-recent year for which I could find reliable data across all desired variables. When a data set involves data from years other than 2008 it is noted below.
US Population
The number I used for the 2008 US population (304,094,000) came from the US Census Bureau as presented via Google Public Data.
Homicides, Suicides, and Accidental Deaths by Cause
To find the number of deaths by cause (i.e., 121,902 accidental deaths total, 592 by guns; 36,035 suicides, 18,233 by guns; and 17,826 homicides, 12,179 by guns) in 2008, I made use of the CDC's Web-based Injury Statistics Query and Reporting System (WISQARSTM). You may notice that I also make use of data from the FBI's Crime in the United States report to calculate other values and that the FBI and CDC provide slightly different counts for the total number of homicides in 2008, 14,180 and 17,826 respectively. This is most likely a consequence of their differing methodologies. See CDC Methodology and FBI Methodology. I have chosen to use the CDC's data primarily for consistency as the FBI's data contains homicides only.Justifiable Homicides
The FBI's Crime in the United States report enumerates justifiable homicides by police (2.6% of homicides) and civilians (1.7% of homicides), counting a homicide as justifiable when "[t]he killing of a felon by a law enforcement officer in the line of duty" or "[t]he killing of a felon, during the commission of a felony, by a private citizen."
As discussed above, the CDC and FBI provide slightly different numbers for 2008 homicides. Consequently, before adding the justifiable homicide data to the graphic, I scaled the numbers such that they were consistant with the percentages of homicides presented in the FBI data. That is, when the FBI data showed 2.6% of homicides attributable to justified homicides by police officers, the final data showed 2.6%.
Victims of Mass Shootings
Following the 2012 attacks in Aurora, Colorado, Mother Jones provided access to its data on mass shootings in the US. The data spans the years 1982 through 2012 and shows 18 mass shooting deaths in 2008: 16 homicides, including one justifiable homicide, and two suicides.
Prevalence of Mental Illness
This is by far the "fuzziest" of my numbers. A clear definition of the category is hard to come by. It becomes a question of line drawing. Should the category include only serious mental illnesses like schizophrenia or should it also count conditions such as depression? For my purposes, I decided to base the number upon data from a US Department of Health and Human Services report which defined and tracked several mental health categories: Serious Mental Illness; Serious Psychological Distress; Suicidal Thoughts and Behavior; and Major Depressive Episode (Depression). The report stated that there was substantial overlap among these populations. Although, the exact nature of that overlap was unclear. It defined Serious Mental Illness as:
...persons aged 18 or older who currently or at any time in the past year have had diagnosable mental, behavioral, or emotional disorder (excluding developmental and substance use disorders) of sufficient duration to meet diagnostic criteria specified within the 4th edition of the Diagnostic and Statistical Manual of Mental Disorders (DSM-IV) (American Psychiatric Association [APA], 1994) that has resulted in serious functional impairment, which substantially interferes with or limits one or more major life activities.See Substance Abuse and Mental Health Services Administration. (2009). Results from the 2008 National Survey on Drug Use and Health: National Findings (Office of Applied Studies, NSDUH Series H-36, HHS Publication No. SMA 09-4434). Rockville, MD. The report placed the prevalence of Serious Mental Illness among the population of Americans 18 and older to be 4.4%, for the purposes of this graphic, I took this to be a general statement regarding the prevalence of mental illness among the population at large. I recognize that this assumption is not entirely accurate for a number of reasons (e.g., the onset of mental illness can occur at many different ages), but given the alternatives, it seemed the most appropriate. For example, I could have confined my data to Americans 18 and older. However, as the FBI and CDC data make clear, a good fraction of homicides and suicides are committed by individuals under 18. Additionally, I could have focused on a broader category including instances such as depression, but such a category is more fluid as a number of individuals may experience such a diagnosis at some point in their lives. Primarily, however, I feel that in the context of gun violence, the term mentally ill is more commonly understood to involve only those with Serious Mental Illness.
Suicides Committed by the Mentally Ill
Here again we run into a problem with definitions. However, a 2004 meta study of "[t]wenty-seven studies comprising 3275 suicides" found that "87.3% (SD 10.0%) had been diagnosed with a mental disorder prior to their death." See Geneviève Arsenault-Lapierre, Caroline Kim and Gustavo Turecki: Psychiatric diagnoses in 3275 suicides: a meta-analysis. BMC Psychiatry 2004, 4:37.
Obviously, this data is not restricted to 2008 or the US for that matter. Again, we run into a problem with line drawing and different methodologies. Here for example, the category of "mental disorder" included substance use disorders. That means 87% is overly inclusive, counting more than those suffering from Serious Mental Illness as defined above. However, as is often the case, the line must be drawn somewhere. Consequently, the graph makes use of this upper limit and assumes 87% of suicides were committed by individuals with "mental illness," fully aware of the fuzziness of that term as used here.
Homicides Committed by the Mentally Ill
Again, we run into the problem of defining and diagnosing mental illness. Consequently, this number too is fraught with issues, and I couldn't find a consensus in the literature. A high estimate seems to be around 10%. See e.g., Homicides by mental ill. Note: this data is not confined to 2008 data.
Accidental Deaths involving the Mentally Ill
Given the absence of available data, I have assumed that the percentages of accidental deaths is constant across the general population and those with mental illness. I recognize that this is unlikely to reflect reality. However, it is unclear to me how these numbers would vary. For example, I can see arguments for the mentally ill being either more or less accident prone than the general population. I simply do not have the data to make a call either way. If you are aware of some, please leave a comment below.
Homicides, Suicides, Accidental Deaths, involving Guns and the Mentally Ill
Similarly, given the absence of available data, I have assumed that the percentages of accidental deaths, homicides, and suicides in which guns were the means of death are constant between the general population and those with mental illness. Again, I recognize that this is unlikely to reflect reality. However, it is unclear to me how these numbers would vary across populations. I simply do not have the data to make a call either way. If you are aware of some, please leave a comment below.
Some Thoughts on Drawing Venn Diagrams, Specifically this One
First it's important to acknowledge what the above graphic is and what it is not. It is a relatively low-resolution visual representation of the data. The existence of high-contrasts between categories suggests a high level of precision, but as you can tell from the discussion above, one should not assume that the graph is accurate to such a level. Given the uncertainly of the data, I would have done better to blur the boarders between categories and stretch the circles a little, but the visual presentation of data is often a balancing act. My goal was to illustrate large-scale relationships. If a viewer plans to count the number of pixels on the graphic to gain insight, (s)he is missing the point.
I produced the above graphic using Flash, but any vector-based drawing program would have worked. Mostly, I'm including this section to head off questions about what program I used to make the image. As a YouTube partner, I find these questions come up a lot. The point is, I didn't have a magic Venn Diagram program. If someone out there knows of one, please leave a comment below.
After collecting the numbers for each of the variables above, I determined what radius (r) circle each independent variable would produce for a given area (A), assuming one unit equals on person, r = sqrt(A/pi).
I scaled these numbers to produce values my program could work with. I really didn't want to work with a 20,000 pixel wide image. I then created appropriately sized circles for each independent variable.
Plotting the intersections of various values required a little ingenuity. It was an easy enough matter to calculate what the area of the intersection should be, and one can easily calculate the area of overlap between two circles. However, determining the distance between two circles needed to produce a specific area of overlap is, shall we say, a bit tricky. So for this I fell back on numerical methods. Which is to say, I created a spreadsheet with a formula cell set to determine the intersection of two circles, say homicides and the mentally ill. I then varied the distance between the two circles until I obtained the desired area of overlap. It was then a simple matter to move the circles in my drawing program to the appropriate places by redefining their coordinates.
The intersection of justifiable homicides and homicides by gun, however, presented a unique set of issues as the values fell at the limit of my setup's resolution and because their intersections placed the center of one circle within the bounds of the other. I estimated the separation between the two by finding a segment height that produced the proper area segment for those justifiable homicides that were not the result of guns. However, given the limits of resolution, and the fact that I had outlined gun deaths with a 1 pixel border, I ended up placing the two justifiable homicide sets in place by hand to make it clear that they weren't entirely within the set of homicides by gun. Given the resolution of the graphic, this seemed appropriate, but it should be noted that their placement is less accurate than the placement of other populations.
† The original version of this page appeared on December 30, 2012. I have made some minor edits. Mostly I fixed a few typos and polished a sentence or two for clarity. When I make any significant changes I will note them in the footnotes.
1I added this paragraph on 1/4/13.